|
|
Future San Francisco Bay Tidal Marshes
|

|
|
|
Future San Francisco Bay Tidal Marshes
|
|
Veloz, S., M. Fitzgibbon, D. Stralberg, S. Michaile, D. Jongsomjit, D. Moody, N. Nur, L. Salas, J. Wood, M. Elrod, and G. Ballard. 2014. Future San Francisco Bay Tidal Marshes: A climate-smart planning tool. [web application]. Petaluma, California. (www.pointblue.org/sfbayslr).
Understanding San Francisco Bay’s vulnerabilities to sea level rise is important for both biodiversity conservation and for management of public infrastructure. Coastal marshes provide essential ecosystem services such as water filtration and flood abatement while also providing important habitat for species of conservation concern. Improving our understanding of how tidal marsh habitats will be affected by sea level rise is important so that we maximize ecosystem services that coastal marshes provide and ensure that endemic populations of plants and animals persist into the future.
For this project, marsh accretion was modeled by ESA PWA using the Marsh-98 model (Orr et al. 2003) and described here. The model assumes that rates of marsh plain elevation change depend on the availability of suspended sediment and organic material, water depth, and duration of inundation periods. If enough suspended sediment is available, then tidal marsh elevations can keep pace with increased inundation.
Model outputs were linearly interpolated in 10-cm increments for starting elevations ranging from -3.7 to 1.7 m (relative to mean higher high water, or MHHW), and applied to a composite 5-m elevation grid (see below) for SF Bay. Results for each possible combination of projected sea level rise, sediment and organic material availability, and target year were combined to produce the scenario layers.
Maps of the distribution of tidal marsh bird species were modeled using boosted regression trees (Elith et al. 2008)and described by Veloz et al. (2011). This method is able to fit non-linear functions between environmental variables and the presence/absence of a species. Map values represent the predicted density (birds per hectare) of a species.
By analyzing changes in species distributions under the different future tidal marsh elevation scenarios we can test how sensitive species are to future climate change and estimate the uncertainty in species responses to our future scenarios.
The digital elevation model (DEM) was developed by The USGS Earth Resources Observation and Science (EROS) Data Center and based on recently collected multibeam bathymetry data and topographic Light Detection and Ranging (LiDAR) remote sensing data (http://viewer.nationalmap.gov/viewer/). Elevations at locations within Suisun Bay were field sampled with GPS data to investigate systematic bias in the data. In some areas, errors due to impenetrable mats of vegetation caused erroneously high elevations. Where possible, vegetation data was used to develop correction factors for these errors then applied to the elevation layer. All datasets were converted to the NAVD88 vertical datum and resampled to a 5 meter resolution. The NAVD88 vertical datum of the elevation data was converted to MHHW reference levels using NOAA tidal gauge and benchmark data. Our models are designed to easily incorporate more accurate elevation data as it becomes available.
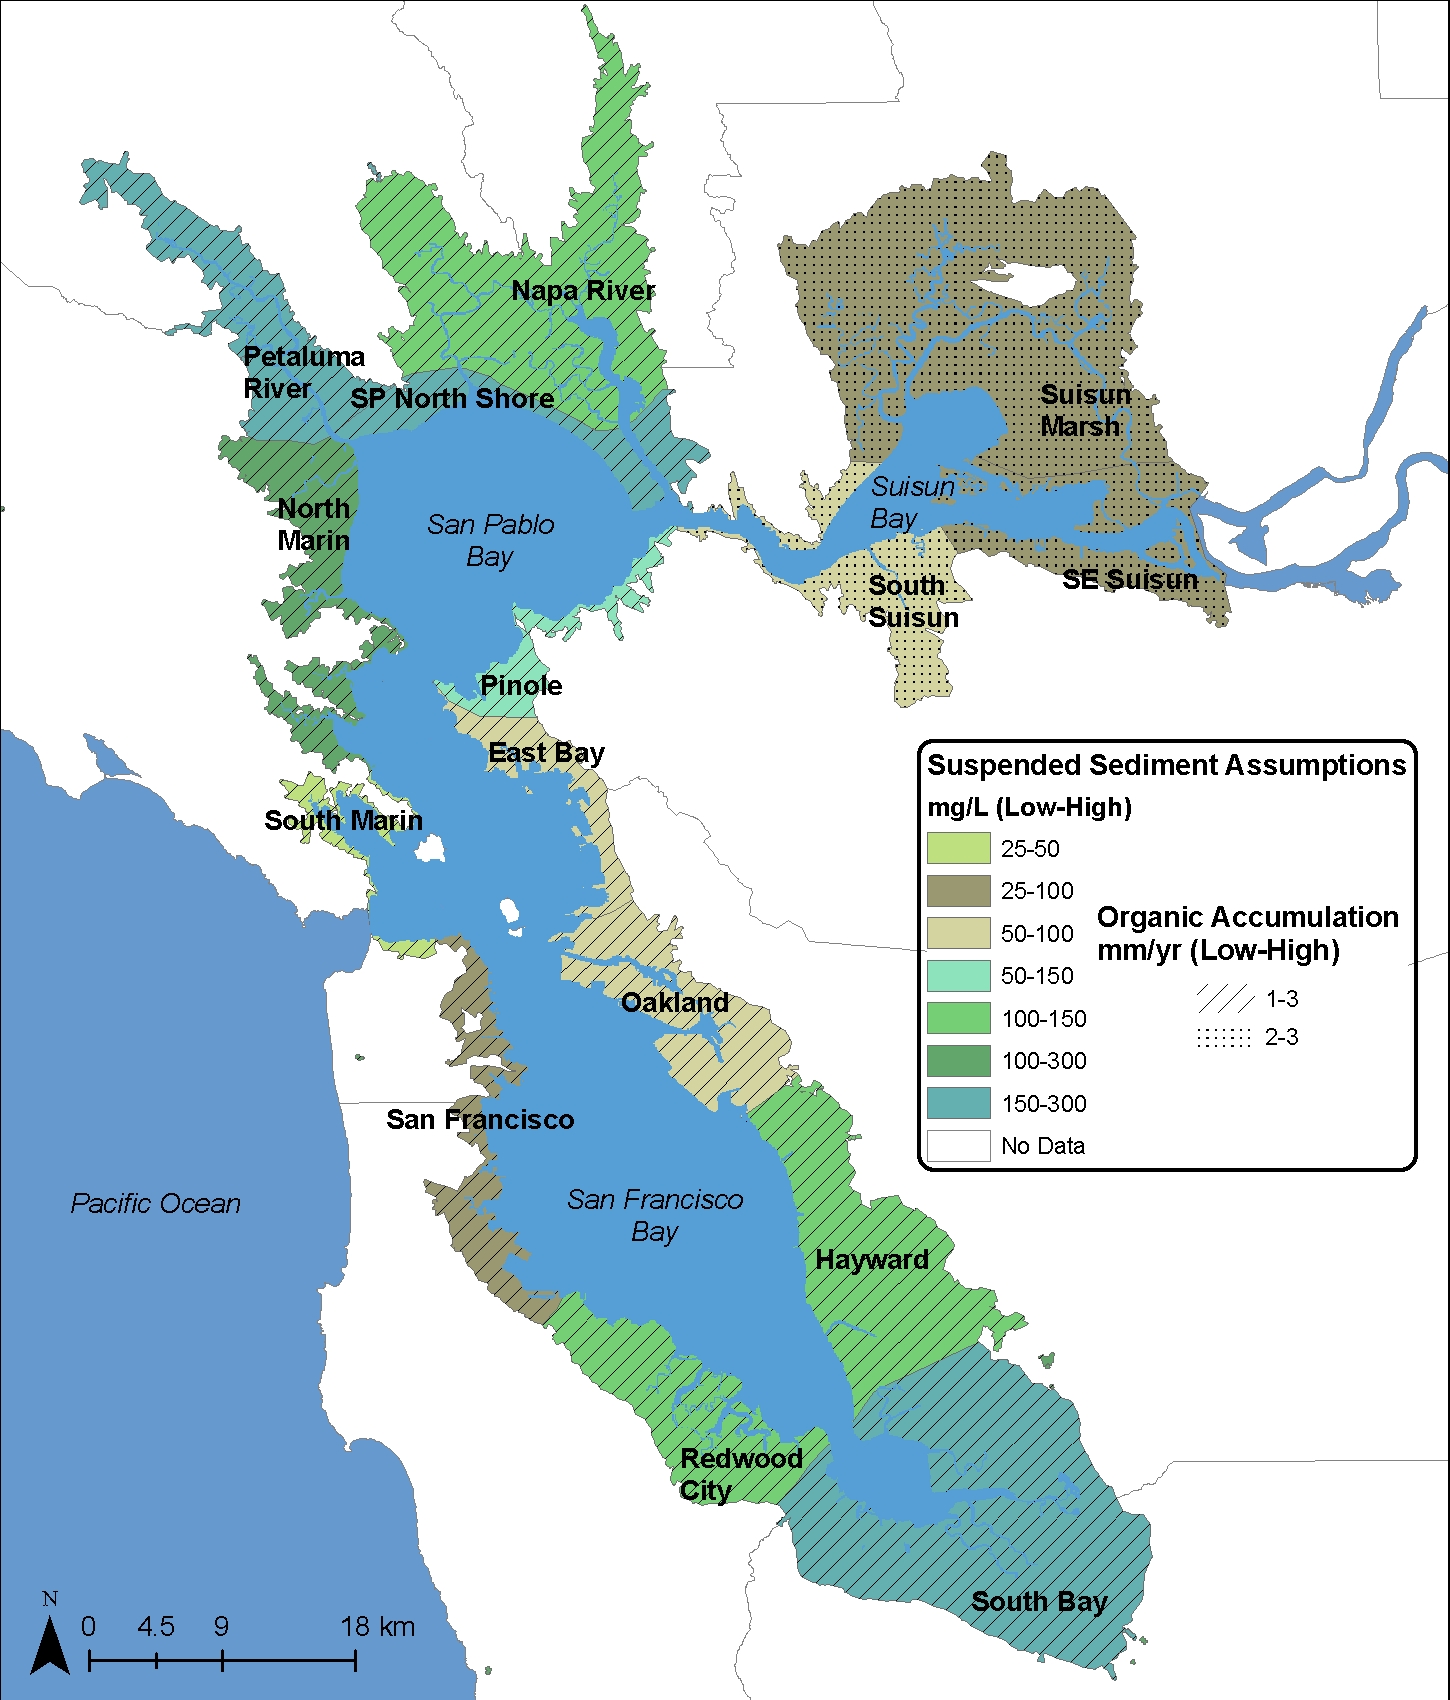
Rates of sea level rise were based on two non-linear scenarios provided by the US Army Corps of Engineers (2009) from curves provided by the National Research Council to project moderate and high sea level rise over the next century (0.52m and 1.65m). Different input parameter values for sediment supply and organic accumulation were given to 15 geographic sub-regions within the bay to account for the regional variability in these values. Each subregion was assigned a high and low value for sediment supply and organic accumulation based on a combination of USGS monitoring reports, observed accretion rates from restored sites, and expert opinion. For future scenarios, six different suspended sediment concentrations were modeled: 25, 50, 100, 150, 200, 250 and 300 mg/L. Three rates of organic matter accumulation were modeled: 1, 2 and 3 mm/yr, encompassing the presumed range of variability within San Francisco Bay including Suisun Bay (see Figure 1 below).
"Diked areas" are areas that are currently restricted from tidal inundation by dikes, levees or roads. A composite diked areas layer was developed based on the San Francisco Estuary Institute's EcoAtlas (http://www.sfei.org/ecoatlas)modern baylands layer, a levee layer developed for the Pacific Institute's sea level rise impacts study (http://www.pacinst.org/reports/sea_level_rise/data/index.htm)and inspection of aerial photography from Google Maps and the Natural Resource Conservation Service.
The urbanization layer was obtained from the NOAA coastal change analysis program (NOAA C-CAP) and is used to identify areas of current and future residential development.
| Name | Definition |
| Bay region | Geographic regions within the bay |
| Percent channel | The percent of a 50m radius circle that includes channels |
| Distance to bay | The distance in meters to the bay |
| Distance to nearest levee | The distance in meters to the closest levee |
| Tidal range | The difference between mean higher high water and mean lower low water. |
| Mean elevation | The mean elevation within a 50m radius circle. |
| High marsh proportion | The percent of a 50m radius circle that contains high marsh habitat (0.2m – 0.3m) |
| Mid marsh proportion | The percent of a 50m radius circle that contains mid marsh habitat (-0.2m – 0.1m) |
| Low marsh proportion | The percent of a 50m radius circle that contains low marsh habitat (-0.5m – -0.3m) |
| Elevation variability | The standard deviation of elevation within a 50m radius circle |
| Spring and summer salinity | Spatial interpolations of observed salinity concentrations in summer and spring (PSU, practical salinity units) |
| Mean slope | Mean value of topographic slopes within a 50m radius circle |
| Distance to urban areas | Distance in meters to the nearest urban area. |
Elith, J., J. Leathwick, and T. Hastie. 2008. A working guide to boosted regression. Journal of Animal Ecology 77:802-813.
Hastie, T. J., and R. J. Tibshirani. 1990. Generalized Additive Models. Chapman & Hall, London.
Liu, L., P. Abbaspour, M. Herzog, N. Nur, and N. Warnock. 2007. San Francisco Bay Tidal Marsh Project Annual Report 2006: Distribution, abundance, and reproductive success of tidal marsh birds. PRBO Conservation Science, Petaluma, CA. download the report
Liu, L., J. Wood, N. Nur, L. Salas, and D. Jongsomjit. 2012. California Clapper Rail (Rallus longirostris obsoletus) Population monitoring: 2005-2011. PRBO Technical Report to the California Department of Fish and Game.
Liu, L., J. Wood, N. Nur, D. Stralberg, and M. Herzog. 2009. California Clapper Rail (Rallus longirostris obsoletus) population monitoring: 2005-2008. Report to California Department of Fish and Game from Point Blue Conservation Science. PRBO Conservation Science, Petaluma, CA. download the report
Orr, M. Crooks, C., and Williams, P. 2003. Will Restored Tidal Marshes Be Sustainable? In: Larry R. Brown, editor. Issues in San Francisco Estuary Tidal Wetlands Restoration. San Francisco Estuary and Watershed Science. Vol. 1, Issue 1 (October 2003), Article 5.
Spautz, H., and N. Nur. 2008b. Suisun Song Sparrow, Melospiza melodia maxillaris. pp. 405-411 in California Bird Species of Special Concern. W. D. Shuford and T. Gardali, Eds. Studies of Western Birds 1. Camarillo and Sacramento, California.
Stralberg, D., M. Brennan, J. Callaway, J. Wood, L. Schile, D. Jongsomjit, M. Kelly, V. T. Parker, and S. Crooks. 2011. Evaluating Tidal Marsh Sustainability in the Face of Sea-Level Rise: A Hybrid Modeling Approach Applied to San Francisco Bay. PLoS ONE 6(11)
Stralberg, D., M. P. Herzog, N. Nur, K. A. Tuxen, and M. Kelly. 2010. Predicting avian abundance within and across tidal marshes using fine-scale vegetation and geomorphic metrics. Wetlands 30:475-487.
US Army Corps of Engineers. 2009. Incorporating Sea-Level Change Considerations in Civil Works Programs. Engineer Circular # 1165-2-211.
Veloz, S., N. Nur, L. Salas, D. Stralberg, D. Jongsomjit, J. Wood, L. Liu, & G. Ballard. 2012. San Francisco Bay Sea-Level Rise Website, A PRBO online decision support tool for managers, planners, conservation practitioners and scientists. Phase II Report to the California Landscape Conservation Cooperative. download the report.