 The metric is the frequency of detection of the species in survey events,
averaged between multiple datasets (eg eBird lists, point count point surveys)
in a particular week of the year and county.
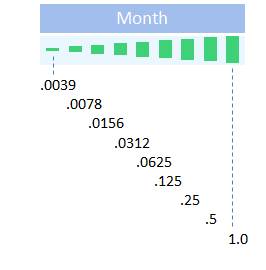
For example, if in week 6 at county Douglas County there were 20 checklists
and AMCR was listed in 10 of these, the value used in creating the histogram
bar will be 0.5. These values are mapped to histogram bars using a log-2 scale as illustrated.
The metric is the frequency of detection of the species in survey events,
averaged between multiple datasets (eg eBird lists, point count point surveys)
in a particular week of the year and county.
For example, if in week 6 at county Douglas County there were 20 checklists
and AMCR was listed in 10 of these, the value used in creating the histogram
bar will be 0.5. These values are mapped to histogram bars using a log-2 scale as illustrated.
Using the Histogram Tool
Select one or more Species (All Species is the default), a State and County (All Counties is the default), and a range of Years (All Years is the default). You can optionally select States and Counties by GIS File or NWR Boundary. Click the "Create Histogram" button to generate the histograms. Learn more here.
Collections
Species
Loading Histograms
