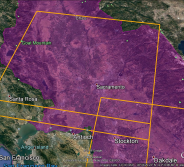
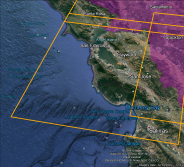
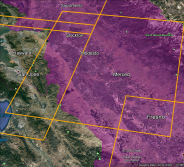
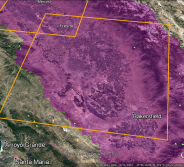
The Landsat satellite mission delivers imagery every 16 days from nearly every place on the earth at a high spatial resolution (30m pixels). We have harnessed these data to automate a process to rapidly quantify open surface water and wetland habitats in the Central Valley. This nearly fully automated system makes processed and summarized data available every 4 to 10 days after the satellite image is acquired. The system makes use of a water classification model first reported by Reiter et al. (2015) and then calibrated for Landsat 8 by Elliott et al. (2016).
Central Valley Water products available below include:
- Individual scene classifications.
- Mosaicked scenes that represent the whole Central Valley together.
- View water maps and extract customized spatial extents.
- View graphical summaries of water distribution.
- Cloud filled images also available.
2013 | 2014 | 2015 | 2016 | 2017 | 2018 | 2019 | 2020 | 2021 | 2022 | 2023 | 2024 | 2025 | 2026 | Full Image Metadata | Image Quality Metadata
| Cycle# | Path 44, Row 33 Sacramento Valley |
Path 44, Row 34 Sacramento River Delta |
Path 43, Row 34 San Joaquin Valley |
Path 42, Row 35 Tulare Basin |
Valley Mosaic #1 Cycle beginning: |
Valley Mosaic #2 Cycle beginning: | ||
|---|---|---|---|---|---|---|---|---|
 |
 |
 |
 |
|||||
| 291 | Jan 14, 2026 GeoTIFF | KML |
Jan 14, 2026 GeoTIFF | KML |
Jan 23, 2026 GeoTIFF | KML |
[No Data Available] | [No Data Available] | Jan 23, 2026 GeoTIFF | KML |
||
| 292 | Jan 30, 2026 GeoTIFF | KML |
Jan 30, 2026 GeoTIFF | KML |
Feb 08, 2026 GeoTIFF | KML |
Feb 01, 2026 GeoTIFF | KML |
Jan 30, 2026 GeoTIFF | KML |
[No Data Available] | ||
| 293 | [No Data Available] | [No Data Available] | [No Data Available] | Feb 17, 2026 GeoTIFF | KML |
[No Data Available] | [No Data Available] | ||
| 294 | Mar 03, 2026 GeoTIFF | KML |
Mar 03, 2026 GeoTIFF | KML |
Mar 12, 2026 GeoTIFF | KML |
[No Data Available] | [No Data Available] | [No Data Available] | ||
| 295 | [No Data Available] | [No Data Available] | [No Data Available] | Mar 21, 2026 GeoTIFF | KML |
[No Data Available] | [No Data Available] | ||
| 296 | [No Data Available] | [No Data Available] | [No Data Available] | [No Data Available] | [No Data Available] | [No Data Available] | ||
| 297 | Apr 20, 2026 GeoTIFF | KML |
Apr 20, 2026 GeoTIFF | KML |
[No Data Available] | Apr 22, 2026 GeoTIFF | KML |
[No Data Available] | [No Data Available] | ||
| 298 | May 06, 2026 GeoTIFF | KML |
May 06, 2026 GeoTIFF | KML |
May 15, 2026 GeoTIFF | KML |
[No Data Available] | [No Data Available] | May 15, 2026 GeoTIFF | KML |
||
| 299 | May 22, 2026 GeoTIFF | KML |
May 22, 2026 GeoTIFF | KML |
[No Data Available] | May 24, 2026 GeoTIFF | KML |
[No Data Available] | [No Data Available] | ||
| 300 | Jun 07, 2026 GeoTIFF | KML |
Jun 07, 2026 GeoTIFF | KML |
Jun 16, 2026 GeoTIFF | KML |
Jun 09, 2026 GeoTIFF | KML |
Jun 07, 2026 GeoTIFF | KML |
[No Data Available] | ||
| 301 | Jun 23, 2026 GeoTIFF | KML |
Jun 23, 2026 GeoTIFF | KML |
[No Data Available] | [No Data Available] | [No Data Available] | [No Data Available] | ||
| 302 | [No Data Available] | [No Data Available] | [No Data Available] | [No Data Available] | [No Data Available] | [No Data Available] | ||
| 303 | [No Data Available] | [No Data Available] | [No Data Available] | [No Data Available] |
Additional Metadata:
Wetland Habitat Structure Maps for the Central Valley of California 2013-2017
Wetland Habitat Structure Maps for the Central Valley of California 2013-2017
Wetland Moist Soil Seed Maps for the Central Valley of California 2007-2017: Vegetation Maps
Wetland Moist Soil Seed Maps for the Central Valley of California 2007-2017: Vegetation Maps