The following is a list of decision-support resources that can be used to help a number of audiences, including state and federal agencies, universities and researchers, industry/developers, conservation organizations and the general public learn more about birds, including information about their range, breeding time-frame, diet and commonly used habitats, where they currently occur and in what quantities, as well as their predicted status and trends in the future. Many of these are interactive tools that allow the user to specify certain query parameters depending on the species and region of interest. These tools may be particularly useful for project siting or prioritizing areas for conservation for particular species. However, they also provide some interesting information for those just interested in learning more about birds in particular areas. To see some of the potential uses of these tools for different audiences, please visit the AKN User Examples page. To see a more extensive list of resources offered through the AKN, please visit the AKN Site Map.
Bird Profiles
Access Bird Photos and Information About Life History, ID Information, Diet, Commonly Used Habitats, and More

Rapid Avian Information Locator (RAIL) – Allows the user allows the user to query a specific geographic location and return a list of birds that are known to occur in that area based on the underlying data in the AKN, along with a wealth of information about those birds including their conservation status and population size at various scales. The tool draws in information from the Partners in Flight (PIF) Avian Conservation Assessment Database (ACAD) and the PIF Population Estimates Database, and also incorporates other supplemental information (e.g. conservation status on multiple scales, clutch size, bird weight, size and diet, primary habitat, photos and range maps) that might be helpful for helping make permitting and conservation and management decisions for birds.
The Cornell Lab of Ornithology’s Birds of the World – Birds of the World is a powerful electronic reference and research database featuring comprehensive life histories of more than 10,800 bird species and deep overviews of all 249 bird families. With scholarly content amassed from four celebrated works of ornithology and ongoing updates by leading ornithologists, these species accounts are integrated with millions of bird records from eBird and rich media resources from the Macaulay Library. Birds of the World provides scientists, students, conservationists, and birders with a sharp picture of the biology of the world’s birdlife. With a subscription users can unlock species accounts, maps, multimedia, and bird family overviews. Learn more about Birds of the World.
The Cornell Lab of Ornithology’s All About Birds – Search profiles of most North American birds. View pictures and listen to sounds to help with bird ID, and learn all about individual birds, from their range to diet and habitat preferences and more.
The Cornell Lab or Ornithology’s Neotropical Birds – Search profiles of neotropical birds. View pictures and listen to sounds to help with bird ID, and learn all about individual birds, from their range to diet and habitat preferences and more.
Bird Presence and Abundance
Use These Tools to Find Out Where Birds Are Occurring, in What Quantities, and What Times of the Year

All Birds (U.S., U.S. Territories, Parts of Northern Mexico):
Rapid Avian Information Locator (RAIL) – Allows the user allows the user to query a specific geographic location and return a list of birds that are known to occur in that area based on the underlying data in the AKN, along with a wealth of information about those birds including their conservation status and population size at various scales. The tool draws in information from the Partners in Flight (PIF) Avian Conservation Assessment Database (ACAD) and the PIF Population Estimates Database, and also incorporates other supplemental information (e.g. conservation status on multiple scales, clutch size, bird weight, size and diet, primary habitat, photos and range maps) that might be helpful for helping make permitting and conservation and management decisions for birds.
AKN Observations Map – The Observations Map allows the user to visualize, query, and investigate data at surveyed locations. It also allows users to identify which data sets are available for further inquiry and analyses. To learn more about the Observations Map, please visit the video tutorial associated with this tool.
AKN Phenology Tool – The Phenology tool allows the user to view abundance and relative probability of presence summaries throughout the year for birds in a particular region or project area. To learn more about the Phenology Tool, please visit the video tutorial associated with this tool.
eBird Explore Tool – Explore maps of eBird observations for species, hotspots, seasonal bar graphs and more. eBird data does feed into AKN, and currently contributes to the results you see in the AKN Observations Map, AKN Phenology Tool and the U.S. Fish & Wildlife Service Information for Planning and Consultation (IPaC) tool, but the eBird data in AKN is limited to 10 years of data, and is only current as of 2015. So, to see maps and seasonal occurrence graphs for eBird data to present (until the AKN is able to be updated with the latest data), you may want to visit and explore the eBird site to examine any recent observations reported through eBird.
Audubon’s Bird Migration Explorer Tool – The Bird Migration Explorer captures the joy of birds and the wonder of migration through a series of interactive maps built using the latest and best-available migration and conservation science. Using this unique digital platform, visitors to the Bird Migration Explorer can learn about the full annual cycle for 458 species of migratory birds that regularly breed in the United States and Canada and use areas in Latin America and the Caribbean during other times of the year.
Select Species (U.S. and U.S. Territories, Parts of Canada and Mexico):
Bird of Concern Or Specific Vulnerability:
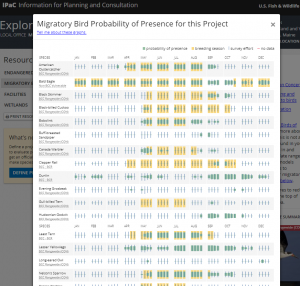
U.S. Fish & Wildlife Service Information for Planning and Consultation (IPaC) – The IPaC tool allows users to view their project or activity’s potential impacts on U.S. Fish & Wildlife Service’s Trust Resources, including endangered and threatened species and migratory bird species of concern. Migratory bird lists in IPaC and associated seasonal probability of presence graphs are generated using best available data on known bird occurrence via data points in the AKN. To learn more about IPaC, please visit the video tutorial associated with this tool.
Atlantic Coast Seabirds (U.S):
Northeast Ocean Data Portal – The Northeast Ocean Data Portal is a centralized, peer-reviewed source of data and interactive maps of the ocean ecosystem and ocean-related human activities in the northeastern United States. The maps on the Portal show the richness and diversity of the ecosystem and illustrate the many ways that humans and environmental resources interact. By providing user-friendly, centralized, and free access to data, information, and tools, the Portal facilitates decision making by a broad range of government agencies, industries, non-government organizations, academic entities, and individuals. Portal users can access data in a variety of ways: by theme, by making custom maps in the Data Explorer, or by directly downloading the data for personal use.
Mid-Atlantic Ocean Data Portal – The Mid-Atlantic Ocean Data Portal is an online toolkit and resource center that consolidates available data and enables state, federal and local users to visualize and analyze ocean resources and human use information such as fishing grounds, recreational areas, shipping lanes, habitat areas, and energy sites, among others.
U.S. Fish & Wildlife Service Information for Planning and Consultation (IPaC) – The IPaC tool allows users to view their project or activity’s potential impacts on U.S. Fish & Wildlife Service’s Trust Resources, including endangered and threatened species and migratory bird species of concern. Migratory bird lists in IPaC and associated seasonal probability of presence graphs are generated using best available data on known bird occurrence via data points in the AKN. To learn more about IPaC, please visit the video tutorial associated with this tool.
AKN Phenology Tool – The Phenology tool allows the user to view abundance and relative probability of presence summaries throughout the year for birds in a particular region or project area. To learn more about the Phenology Tool, please visit the video tutorial associated with this tool.
IBAT – IBAT offers a ‘one-stop shop’ data search service for those seeking authoritative global biodiversity information. One of IBAT’s most popular functionalities is its biodiversity data report delivered as a package that includes a pdf document, raw data in CSV format, and map files. IBAT report templates include a simple proximity report, a World Bank Group risk report, and a freshwater report. Click here to view all of the reports IBAT offers.
107 Select Bird Species (U.S. and U.S. Territories, Parts of Canada and Mexico):
E-bird Status and Trends – eBird Status and Trends provide an unparalleled window into the full annual cycle of bird populations in North America. Cornell Lab of Ornithology researchers have developed these novel statistical techniques to model eBird data across continents at fine spatiotemporal scales. Maps, charts and other products explore the range, abundance, habitat, and trends for each species. For a handful of species, you can also look at information about abundance and habitat in an interactive map through an E-bird tool call BirdVis.
Waterbirds, Osprey, Nightjars and Eagle Nests and Roosts (VA):
Center for Conservation Biology Mapping Portal– Offers locations and abundance information for several species of waterbirds, as well as Osprey, Nightjars. It also offers location information for known eagle nests and roosts in Virginia. Note that some data may be outdated, please check the accompanying dates and information provided on the portal.
Select U.S. Regions:
Rocky Mountain Avian Data Center (RMADC) Coverage (Arizona, California, Colorado, Idaho, Kansas, Montana, Nebraska, New Mexico, Nevada, North Dakota, Oklahoma, South Dakota, Texas, Utah, and Wyoming):
RMADC Data Exploration and Analysis Interface – This tool draws from underlying Rocky Mountain Bird Observatory (RMBO) data to allow the user to view a map where they can query and visualize species detections by species type, multiple spatial and temporal extents, study design type, and several other parameters. Users can also add different base layers to view with those detections (BCRs, National Park Service lands, BLM Fields Offices, DOD lands, and more). Furthermore, the tool allows the user to see summaries and graphic representations on species density, occupancy and counts at the state and BCR levels. To learn more about the RMADC Data Exploration and Analysis Interface, please visit the video tutorials associated with this tool.
Borderlands Avian Data Center Coverage ( Southern CA, Southern NV, Arizona, New Mexico, Texas, Oklahoma, and Northern Mexico):
Borderlands Avian Data Center Mapper – Allows the user to query, visualize, and investigate bird observation data at surveyed locations in a map interface. It also allows users to identify which data sets are publicly available for further inquiry and analyses. This map allows the user to select overlays of IBAs and AICAS, Joint Ventures, Natural Protected Areas in Mexico, Ramsar Sites, U.S. Congressional Districts and more. MAPS Station Banding data can be visualized on the map, along with a number of AKN datasets, E-bird and BBS.
Avian Knowledge Northwest Coverage (Oregon, Washington, Idaho, northern California and Nevada, parts of Northwestern Canada, western Montana and northwestern Wyoming):
AKNW Data Exploration Map – The Data Exploration Map tool is a portal to explore Avian Knowledge Northwest datasets. A variety of data types can be queried for specific areas (i.e., county, watershed, public lands) of the Klamath-Siskiyou Bioregion of southern Oregon and northern California.
Important Bird Habitat
Use These Tools to Find Out Where Important Bird Habitats and Areas Are Located
Great Lakes
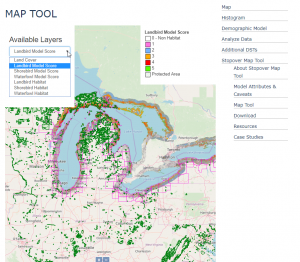
Great Lakes Migratory Bird Stopover Tool – Maps potential stopover habitats across the region based on available GIS data layers. The maps were created by identifying attributes associated with stopover sites that could be mapped with regionally (US and Canada) available data layers, developing criteria to score these attributes, and then producing maps based on these scores to indicate the relative importance of stopover sites in our study area.
Western Oregon
Aquatic Bird Sites – In an effort to help coordinate aquatic bird monitoring and facilitate regionally based studies, Klamath Bird Observatory has compiled and posted descriptions for Important Aquatic Bird Sites within eastern Oregon, western Oregon, and northwestern California. The site descriptions include information such as water level fluctuations, land ownership, access issues, visibility constraints, and aquatic birds expected to be present.
Nationwide for 107 Bird Species
E-bird Status and Trends – eBird Status and Trends provide an unparalleled window into the full annual cycle of bird populations in North America. Cornell Lab of Ornithology researchers have developed these novel statistical techniques to model eBird data across continents at fine spatiotemporal scales. Maps, charts and other products explore the range, abundance, habitat, and trends for each species. For a handful of species, you can also look at information about abundance and habitat in an interactive map through an E-bird tool call BirdVis.
Nationwide
Audubon Important Bird Areas– Audubon spearheads an ambitious effort to identify, monitor, and protect the most important places for birds. They also collaborate with 19 international partners to extend a web of protection throughout the Western Hemisphere. To date Audubon has identified 2,758 IBAs covering 417 million acres of public and private lands in the United States. Use the Audubon Important Birds Areas tool to find locations of IBAs and see more information about the IBA and the birds that are typically found there.
IBAT – IBAT offers a ‘one-stop shop’ data search service for those seeking authoritative global biodiversity information. One of IBAT’s most popular functionalities is its biodiversity data report delivered as a package that includes a pdf document, raw data in CSV format, and map files. IBAT report templates include a simple proximity report, a World Bank Group risk report, and a freshwater report. Click here to view all of the reports IBAT offers.
Predicted Bird Distributions
Use These Tools to View Predicted Bird Distributions
California – Central Valley
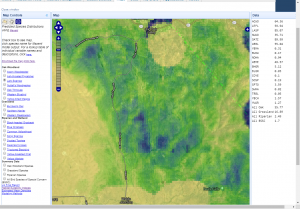
Predicted Bird Species Distribution in Central Valley (LIP)(2008) – The development of sophisticated species distribution modeling techniques provides an opportunity to greatly improve the value of species occurrence data. Using statistical and machine learning approaches, point occurrence data can be related to GIS-based environmental data layers to generate robust, spatially continuous predictions of species occurrence. The approach was to use a machine learning algorithm called Maxent to predict species distributions for a variety of species in California’s Central Valley.
Nationwide for 107 Bird Species
E-bird Status and Trends – eBird Status and Trends provide an unparalleled window into the full annual cycle of bird populations in North America. Cornell Lab of Ornithology researchers have developed these novel statistical techniques to model eBird data across continents at fine spatiotemporal scales. Maps, charts and other products explore the range, abundance, habitat, and trends for each species. For a handful of species, you can also look at information about abundance and habitat in an interactive map through an E-bird tool call BirdVis.
Predicted Changes in Bird Distributions
Use These Tools to See How Changes in Habitat and Climate Might Impact Certain Birds
Pacific Northwest
Oak Bird Pop: An Online Interactive Supplement to the Land Manager’s Guide to Bird Habitat and Populations in Oak Ecosystems of the Pacific Northwest – An interactive tool to inform land managers and others in the Pacific Northwest in the planning and implementation of oak habitat management and restoration actions. The goal is to help assess the projected population response of 31 oak-associated bird species to oak habitat changes. OakBirdPop serves as an interactive supplement to the Land Manager’s Guide to Bird Habitat and Populations in Oak Ecosystems of the Pacific Northwest.
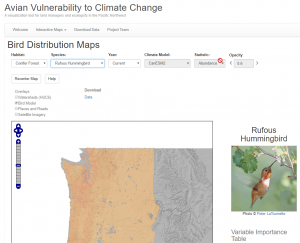
Avian Vulnerability to Climate Change Maps – Projects climate-driven changes in the abundances and distributions of 31 focal bird species in Oregon and Washington using the latest down-scaled climate projections and corresponding vegetation model outputs.
Pacific Northwest Climate Change Avian Vulnerability Tool – Developed by the North Pacific Landscape Conservation Cooperative, to inform your management about the effects of climate change on bird species found in western Washington, Oregon and California. You can use this tool to (1) view spatially explicit projections of climate change impacts to 26 bird species, (2) explore regions of high conservation priority, (3) analyze changes in bird habitat and bird communities, (4) identify new monitoring locations which can improve our understanding of climate change impacts, and (5) download our model results to use in your own analyses.
California
Future San Francisco Bay Tidal Marshes – A Climate-Smart Planning Tool – The tool can be used to (1) view and query maps to understand how sea level rise may change the extent of tidal marsh habitat and bird species distribution over the next 100 years; (2) make informed decisions about adaptation planning, restoration potential, and land acquisition given various sea-level rise and sedimentation scenarios; and (3) identify areas both vulnerable and resilient to future sea-level rise.
Modeling Bird Distribution Responses to Climate Change – This tool networks climate models and multi-source bird data to predict current and future species distributions for California terrestrial breeding bird species. There are nearly 200 species available for viewing. These species represent 7 major habitat types found within California including riparian, oak woodland, scrub, conifer, grassland, wetlands, and desert habitat types.
Nationwide for 107 Bird Species
E-bird Status and Trends – eBird Status and Trends provide an unparalleled window into the full annual cycle of bird populations in North America. Cornell Lab of Ornithology researchers have developed these novel statistical techniques to model eBird data across continents at fine spatiotemporal scales. Maps, charts and other products explore the range, abundance, habitat, and trends for each species.
Bird Status and Population Information
Use These Tools and Plans to View Status and Population Information for Birds
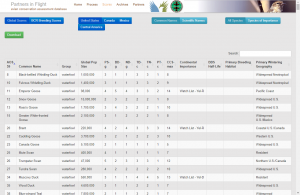
Partner’s in Flight Species Assessment Database – This database provides global and regional conservation assessments of each bird species that, among other uses, can be used to objectively assign regional and continental conservation priorities among birds. Currently, Bird Conservancy of the Rockies maintains PIF species assessment data on all bird species in the U.S. Canada, and Mexico.
Partner’s in Flight Landbird Population Estimation Database – This database aims to: (1) provide users access to the estimates of landbird populations published in the North American Landbird Conservation Plan (Rich et al. 2004), which were based mainly on Breeding Bird Survey data from the 1990s: (2) allow users to view and download estimates for landbird populations at a variety of geographic scales, and (3) provide transparent access to the methodologies, assumptions, data sources, and species-specific correction factors used by Partners in Flight to create these estimates.
The Institute for Bird Populations’ MAPS Data Exploration Tool. The MAPS Data Exploration Tool provides public access to a variety of analytic results and data associated with the Monitoring Avian Productivity and Survivorship (MAPS) program. The tool allows users to download MAPS capture/recapture records, as well as interactively view and download a number of demographic analyses derived using the program-wide 1992-2018 MAPS data set for a large number of avian species across North America. Analyses of MAPS data can be used to identify spatial and temporal patterns in vital rates and population dynamics and to provide inferences about which vital rates are most strongly linked to population changes. MAPS data can also be used to help understand how factors like weather, climate, land use, and disease affect bird populations. Finally, data collected at MAPS stations can also be used to provide insight into other aspects of avian ecology such as molt strategies, migration, and other seasonal movements.
Bird Conservation Plans – View a variety of plans that assess species status and recommend conservation actions.
Canada
Nature Counts Population Trends and Seasonal Abundance Tool – This population trends tool allows you to display estimated annual indices of population size at particular survey locations in Canada over time, with an optional loess smoothed trend line, for a selected time period and season (note however that trend is only calculated on the entire sampling period at each site). Plots for multiple locations and species can be displayed at once. You can start by selecting a project, and then one or more area, and one or more species (you can select multiple areas or species by holding the CTRL key), as well as the other optional features.
House and Analyze Your Data in AKN
Add Your Data to Improve Tools, Manage Records and Get Access to Analyst Tools to Look at Patterns and Trends in Your Data
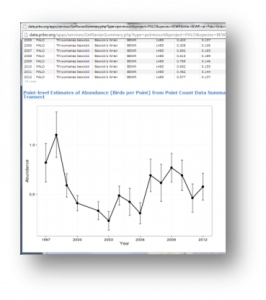
AKN Data Entry and Management Tools – Learn about how to get set up to enter or upload your data in the AKN.
AKN Analyst Tool – This application within the AKN enables users to retrieve and analyze data they own, or that has been shared with them by a project owner. This application is designed for people with some knowledge about the data, offers password-protected access, and is intended to help develop project reports. To learn more about the Analyst, please visit the video tutorial associated with this tool.
Do It Yourself Analysis
Obtain/Download Raw Data
Data Downloader (Access All Publicly Available AKN Data) – The AKN offers this application specifically for downloading observations that the owners of data in the AKN have made publicly available (AKN Sharing Level 5). The downloads provided through the Data Downloader are meant to be used in cross project comparisons and studies. The data is simplified to the common fields for each survey type and does not include project specific data that may have been collected. Each row in a download includes a catalog identifier indicating what dataset that row came from. The application allows users to select and download large datasets using several optional filters including protocol type, beginning and ending date, species and guild, region type (USNABCI BCRs, LCC, US State boundaries, etc), and Project Names. Data owners or users that have been given access to a dataset by a Project Leader may also use the Data Downloader to download that data. In this case, downloaded data will include all dataset fields. To use the Data Downloader, you must first register for a user account by filling out the online user registration form. Users that already have an account can access the Data Downloader here. To learn more about the Data Downloader, please visit the video tutorial associated with this tool. Data Catalog (Discover AKN Data that is not publicly available) – The AKN publishes a Data Catalog that may be searched without an AKN account. The Catalog provides summary information about all of the datasets that are currently curated in AKN systems (with the exception of E-bird and Breeding Birds Survey). Data owner contact information is listed in the summary under “Author” to allow user to contact data owners, if desired. Data summaries include several pieces of information including geospatial information, species lists, number of species, number or records, survey type, data sharing level(s) and more. Survey datasets that contain publicly available (Level 5) data include a link to the Data Downloader for that project, to allow user to download any publicly available data. You can search and review the data catalog here. To learn more about the Data Catalog, please visit the video tutorial associated with this tool.. Breeding Bird Survey (BBS) – You may retrieve raw data associated with the BBS dataset at the USGS North American Breeding Bird Survey website. The AKN utilizes a portion of the BBS dataset (all data up until 2016) in its mapping tools, IPaC, and the Phenology Tool. E-bird – You may retrieve raw data associated with the E-bird dataset directly from the E-bird website. The AKN utilizes a portion of the E-bird dataset (the E-bird observation dataset up until November 15 – including only approved observations that are part of a complete checklist) in its mapping tools, IPaC, and the Phenology Tool.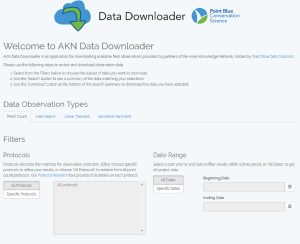
Other Helpful Tools
Use These Tools to Look at Other Important Information About Your Area of Interest
Marine Resources and Information
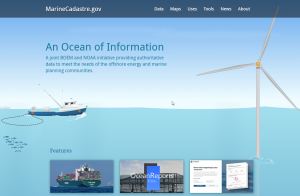
MarineCadastre.gov – MarineCadastre.gov is an integrated marine information system that provides data, tools, and technical support for ocean and Great Lakes planning. MarineCadastre.gov was designed specifically to support renewable energy siting on the U.S. Outer Continental Shelf but also is being used for other ocean-related efforts. MarineCadastre.gov includes the Ocean Reports Tool, which is a web-based, reportcentric
tool for coastal and ocean planners. Powered by over 100 datasets, it provides summary statistics and infographics for six main topics: general information, energy and minerals, natural resources and conservation, oceanographic and biophysical, transportation and infrastructure, and economics and commerce.

OceanReports – Ocean Reports is a web-based, report-centric tool for coastal and ocean planners. It provides summary statistics and infographics for six main topics: general information, energy and minerals, natural resources and conservation, oceanographic and biophysical, transportation and infrastructure, and economics and commerce. Users simply need to draw a polygon to return data and infographics specific to their area of interest.
IBAT – IBAT offers a ‘one-stop shop’ data search service for those seeking authoritative global biodiversity information. One of IBAT’s most popular functionalities is its biodiversity data report delivered as a package that includes a pdf document, raw data in CSV format, and map files. IBAT report templates include a simple proximity report, a World Bank Group risk report, and a freshwater report. Click here to view all of the reports IBAT offers.
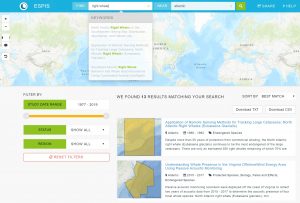
Environmental Studies Program Information System (ESPIS) – The ESPIS query tool enables users to search by text or map to find relevant Bureau of Ocean Energy Management study information, including downloadable study profiles, technical summaries and final reports, and links to publications and digital data.
