
Interactive Map
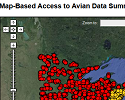 The MWADC Map Tool provides a quick and easy way to visualize, query, and investigate data at surveyed locations. It also allows users to identify which data sets are available for further inquiry and analyses.
Histogram
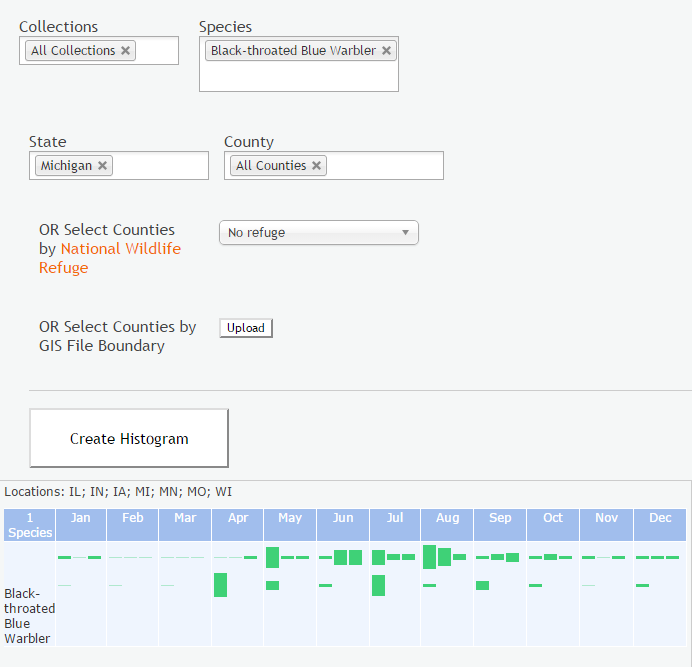
The MWADC Histogram Tool shows the temporal distribution of a given species or set of species over the course of a year. You can look at distributions of birds using various data collections, choosing to filter by species, county, state, or custom shapefile.
Demographic Model
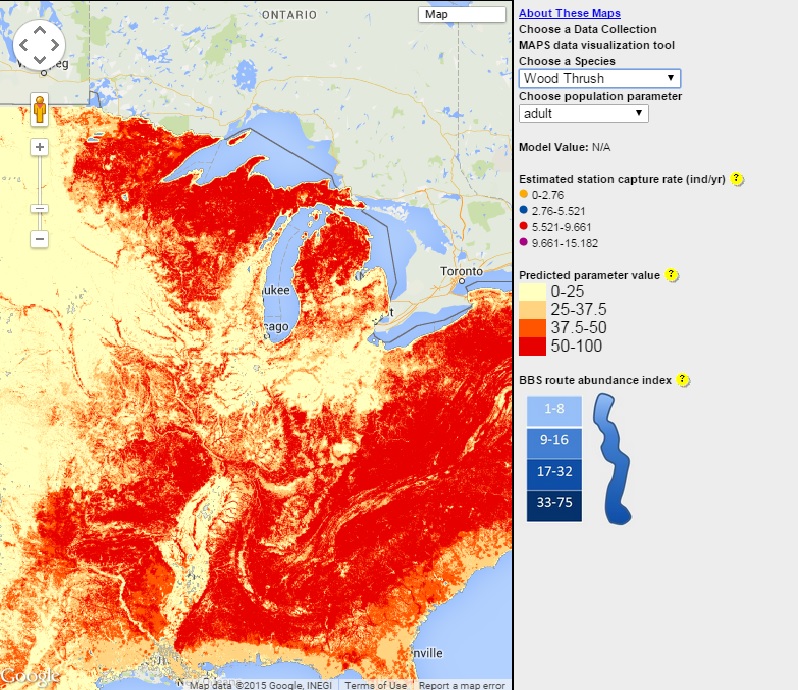 The MWADC Demographic Model Tool offers several useful products: 1) baseline demographic parameter estimates (including survivorship and productivity), 2) maps of protected lands indexed by their potential to provide source habitat, 3) GIS tools allowing managers to analyze landscapes and extract specific spatial statistics for input to models, and 4) species management guidelines for creating or maintaining source habitat.
Analyze Data
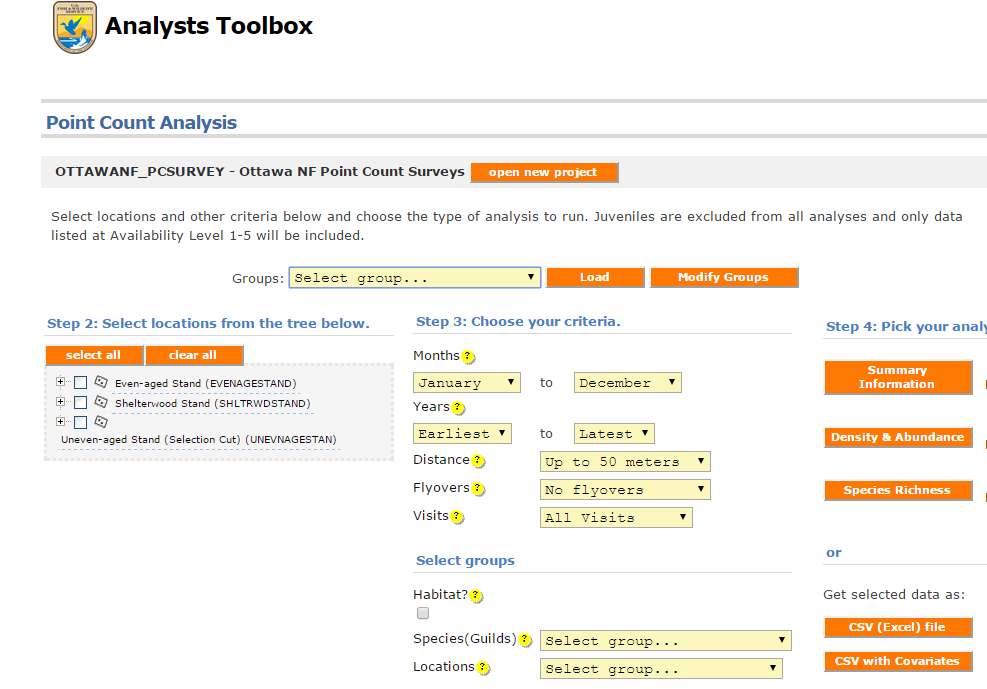
Use Ravian, a server-based analysis package for visualizing AKN data, to generate simple visualizations or apply advanced analyses to MWADC data.
Additional Decision Support Tools
Explore other Decision Support Tools that can guide and facilitate bird conservation throughout the Midwest region.
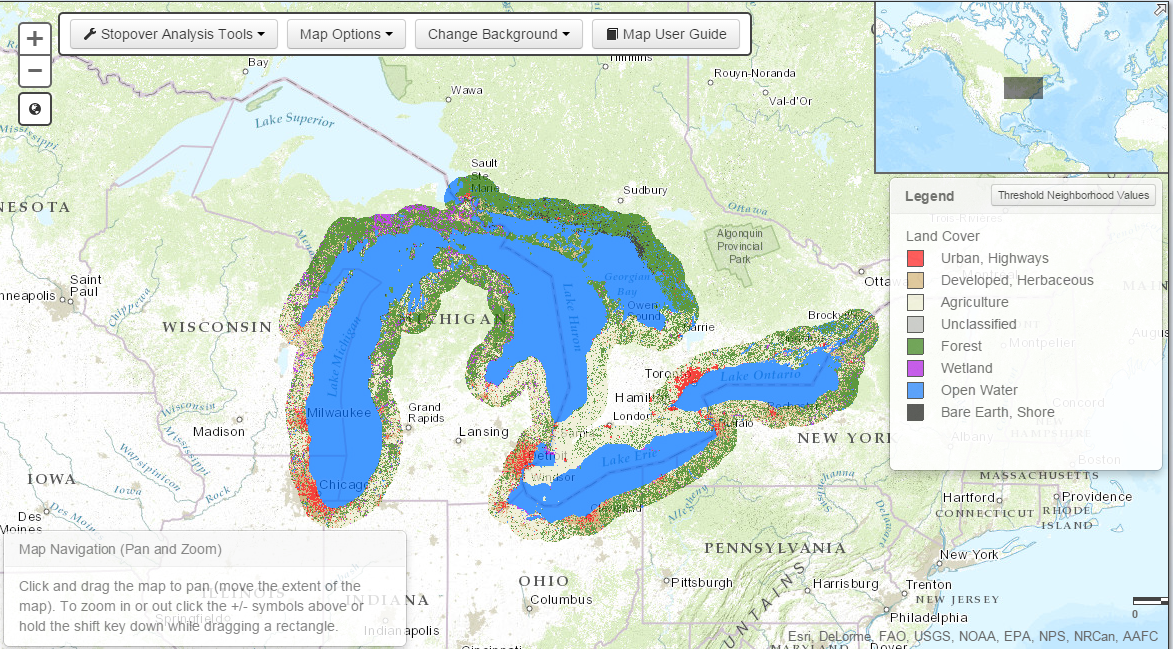
Stopover Map Tool
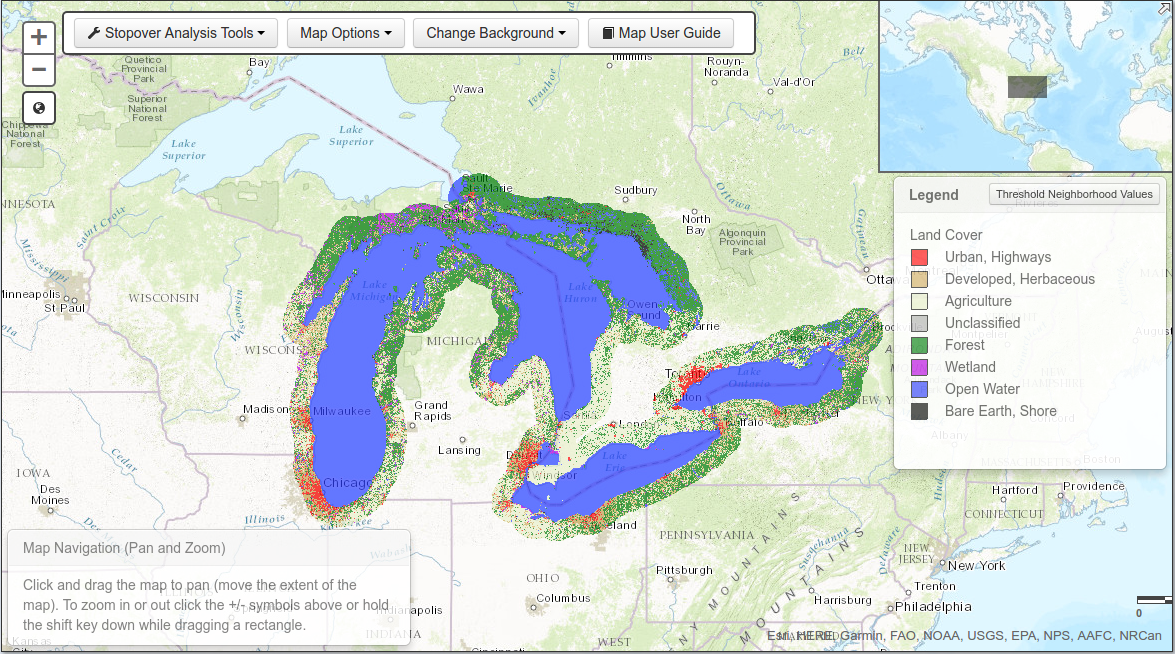 Great Lakes Migratory Bird Stopover Map Tool: The Nature Conservancy, in partnership with the U.S. Fish and Wildlife Service, many conservation organizations, universities, and corporations, developed this web map tool to model stopover habitat and further conservation efforts for migrating birds in the Great Lakes region.